Table of Contents
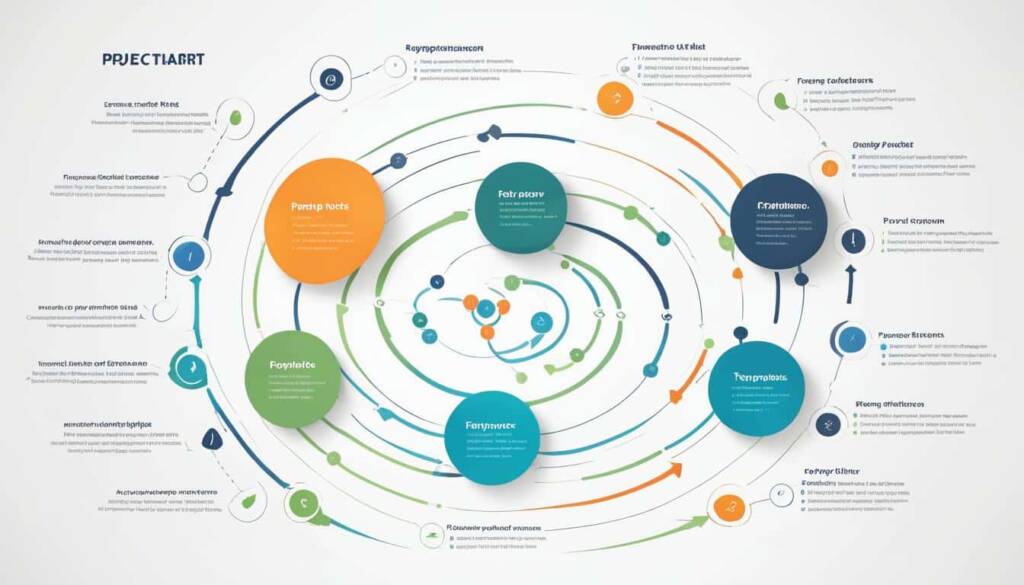
A PERT chart, also known as a Program Evaluation Review Technique chart, is a project management tool used to schedule, organize, and coordinate tasks within a project. It provides a visual representation of a project’s timeline, enabling project managers to break down each individual task and analyze its dependencies. The PERT chart template uses nodes, represented as rectangles or circles, to depict events and milestones in the project. These nodes are connected by vectors, represented as lines, which illustrate the tasks that need to be completed.
PERT charts allow project managers to estimate the minimum time required for project completion, analyze the work breakdown and task connections, and assess project risk. They are especially useful for visualizing the dependencies between each step of a complex process and organizing projects with multiple moving parts.
Project planning can be a challenging task, particularly when dealing with complex projects. PERT charts offer project managers a valuable tool to visualize and manage these complex tasks effectively. They provide a clear and concise snapshot of the timeline and task dependencies, making it easier to allocate resources, create a project schedule, and identify the critical path.
By using a PERT chart, project managers can better plan and allocate resources to ensure project completion within the desired time frame. It also enables effective communication among project team members, stakeholders, and clients, improving project visibility and alignment.
In the following sections, we will explore how to use a PERT chart in project management and discuss its advantages and disadvantages in more detail. Let’s dive in!
How to Use a PERT Chart in Project Management
To effectively use a PERT chart in project management, it is essential to follow a systematic approach that emphasizes project planning, task dependencies, project duration, critical path, and project schedule. The following steps outline the process:
- Define the project scope and objectives: Clearly understand the project’s goals and deliverables to establish a solid foundation for planning.
- Break down the project into tasks: Identify all the tasks that need to be completed to achieve the project objectives. Ensure that each task is clearly defined and has a specific start and end point.
- Determine task dependencies: Determine the dependencies between tasks to understand the sequence in which they need to be executed. This will help in identifying the critical path later on.
- Estimate task durations: Estimate the time required to complete each task. It is important to consider factors such as resource availability and potential risks that may impact the duration.
- Identify the critical path: The critical path is the sequence of tasks that determines the overall project duration. It is crucial to identify the tasks that are on the critical path as any delays in these tasks will directly impact the project schedule.
- Create the PERT chart: Use a PERT chart tool or software to create a visual representation of the project tasks, their dependencies, and the critical path. The PERT chart will provide a clear overview of the project timeline and facilitate effective project management.
- Monitor and update the PERT chart: Continuously monitor the progress of each task and update the PERT chart accordingly. This will help in tracking the project’s status and making necessary adjustments to ensure timely completion.
By following these steps and utilizing a PERT chart, project managers can enhance project planning, track task dependencies, determine project duration, identify the critical path, and establish a comprehensive project schedule.
Example PERT Chart:
| Task | Description | Predecessors | Duration (in days) |
|---|---|---|---|
| Task 1 | Project Initiation | – | 5 |
| Task 2 | Requirements Gathering | Task 1 | 10 |
| Task 3 | Design and Wireframing | Task 2 | 7 |
| Task 4 | Development | Task 3 | 14 |
| Task 5 | Testing and Quality Assurance | Task 4 | 7 |
| Task 6 | Deployment | Task 5 | 5 |
| Task 7 | Project Closure | Task 6 | 3 |
Advantages and Disadvantages of PERT Charts in Project Management
Using PERT charts in project management brings numerous advantages to handling complex projects. These charts enable project scheduling by providing a clear visual representation of the project’s timeline, task dependencies, and critical path. Project managers and team members can easily identify the sequence of tasks and allocate resources accordingly, resulting in improved project estimation and efficient utilization of resources.
One of the key benefits of PERT charts is their ability to manage complex projects effectively. By visualizing the task dependencies and identifying the critical path, project managers can allocate resources strategically and optimize project schedules. PERT charts also enhance communication among team members and stakeholders by offering a shared understanding of project expectations and progress.
Furthermore, PERT charts provide project visibility, allowing stakeholders to gain a comprehensive overview of the project’s progress and potential risks. This increased transparency fosters collaboration and facilitates timely decision-making, ensuring that the project stays on track. Through effective project visibility, PERT charts enable project managers to anticipate and address potential bottlenecks, streamlining project execution and reducing the risk of project delays.
Despite the advantages, PERT charts also have certain limitations. They rely heavily on accurate task estimation and well-defined task dependencies. Any inaccuracies in these areas can potentially impact the reliability and effectiveness of the chart. Additionally, PERT charts might require significant time and effort to create and maintain, especially for large and complex projects. It is important to strike a balance between the benefits of utilizing PERT charts and the investment of resources required to implement and update them throughout the project lifecycle.
FAQ
What is a PERT chart?
A PERT chart, also known as a Program Evaluation Review Technique chart, is a project management tool used to schedule, organize, and coordinate tasks within a project. It provides a visual representation of a project’s timeline, enabling project managers to break down each individual task and analyze its dependencies.
How does a PERT chart work?
A PERT chart uses nodes, represented as rectangles or circles, to depict events and milestones in the project. These nodes are connected by vectors, represented as lines, which illustrate the tasks that need to be completed. PERT charts allow project managers to estimate the minimum time required for project completion, analyze the work breakdown and task connections, and assess project risk. They are especially useful for visualizing the dependencies between each step of a complex process and organizing projects with multiple moving parts.
How can I effectively use a PERT chart in project management?
To effectively use a PERT chart in project management, follow these steps:
What are the advantages of using PERT charts in project management?
PERT charts offer several advantages for project management. They help in project scheduling and allow project managers to better understand complex projects by visualizing the task dependencies. PERT charts also aid in estimating project duration, identifying the critical path, and creating an effective project schedule. Additionally, PERT charts enhance communication and provide project visibility, allowing stakeholders to have a clear understanding of the project’s progress and potential risks.
Are there any disadvantages to using PERT charts in project management?
While PERT charts are beneficial for project management, they also have some limitations. PERT charts can be time-consuming to create and maintain, especially for large and complex projects. Additionally, if the project scope or task dependencies change frequently, the PERT chart may need constant updating, which can be challenging. It’s also important to note that PERT charts rely on accurate data and estimations, which may vary in real-world scenarios, potentially impacting the accuracy of the chart’s predictions.


