Table of Contents
Knowing your system’s hardware details is essential for maintenance, upgrades, and troubleshooting. Whether you’re a gamer, IT professional, or casual user, this guide helps you uncover critical details about your device.
Why does it matter? Software compatibility, performance optimization, and upgrade planning all rely on accurate hardware knowledge. Windows provides built-in tools, while third-party solutions offer deeper insights.
This article explores multiple methods—from simple system checks to advanced diagnostic tools. Discover which approach works best for your needs and gain confidence in managing your machine.
Why Checking Your PC Specifications Matters
System failures often trace back to overlooked compatibility gaps. Nearly 70% of software crashes stem from mismatched hardware, wasting time and resources. Whether upgrading or troubleshooting, knowing your device’s capabilities ensures seamless performance.
Understanding Hardware and Software Compatibility
Modern applications demand precise component alignment. Photoshop, for example, recommends 16GB RAM for smooth operation. Mismatched parts cause 33% of system failures, from sluggish response to total crashes.
A corporate CRM upgrade failed recently due to unverified CPU requirements. The team assumed compatibility, but outdated processors couldn’t handle the new software. Verifying hardware beforehand would’ve saved weeks of downtime.
Planning Upgrades and Troubleshooting
SSDs slash app load times by 40-60% compared to HDDs. Informed upgrades prevent wasted spending on incompatible parts. Outdated BIOS/UEFI firmware also poses security risks, leaving systems vulnerable to exploits.
| Application | Minimum RAM | Recommended Storage |
|---|---|---|
| Adobe Photoshop | 8GB | SSD, 500GB+ |
| Video Editing (4K) | 32GB | NVMe SSD, 1TB+ |
Uninformed purchases lead to costly mistakes. A $200 graphics card might lack the VRAM needed for gaming, forcing a second buy. Always cross-reference system requirements before investing.
How to Check PC Specs Using Windows Settings
Windows provides quick access to core hardware details without third-party tools. The Settings app displays CPU, RAM, and OS data—ideal for quick reference or support requests.
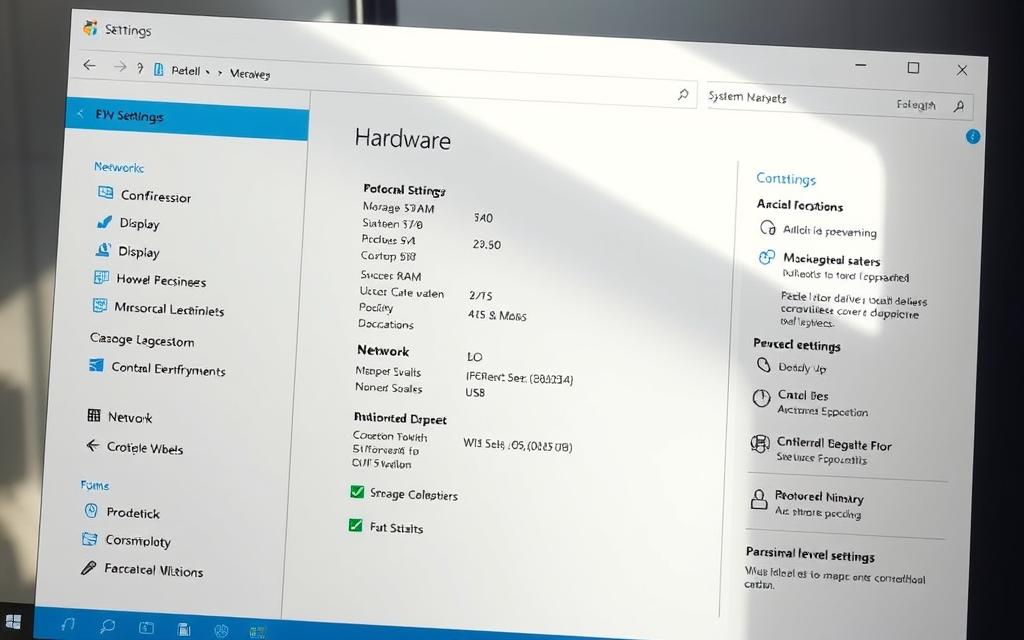
Opening the Settings App
Three methods work across Windows 10 and 11:
- Press Windows + I (fastest shortcut)
- Search “Settings” in the Start menu
- Use Control Panel > System (legacy)
Navigating to System Information
Select System > About to view:
| Component | Details Shown | Limitations |
|---|---|---|
| Processor | Model and speed | No core/thread count |
| RAM | Installed capacity | Speed not listed |
| OS | Version and build number | 32-bit vs 64-bit only |
Click “Copy” to save details for troubleshooting. Note: GPU and motherboard data require advanced tools.
Understanding System Architecture
32-bit systems limit RAM to 4GB. For modern software, 64-bit is essential. Verify this under Device specifications.
Driver versions and storage details appear elsewhere. Use Task Manager for real-time performance metrics.
Using Task Manager to Check Real-Time Performance
Monitoring real-time system metrics helps prevent performance bottlenecks before they impact workflow. The Task Manager reveals live data on CPU, RAM, and GPU usage—critical for diagnosing slowdowns or planning upgrades.
Opening Task Manager
Press Ctrl + Shift + Esc for instant access. Alternatively, right-click the taskbar or use Ctrl + Alt + Delete. The default view shows running apps; switch to the Performance tab for detailed metrics.
Reviewing CPU, Memory, and GPU Usage
Sustained CPU utilization above 90% signals strain. Check core distribution—uneven loads may indicate software issues. For memory, compare “In Use” vs. “Available” values to identify leaks.
| Component | Healthy Threshold | Upgrade Trigger |
|---|---|---|
| CPU | ≤80% under load | Consistent ≥90% |
| RAM | ≤70% usage | Frequent ≥85% |
| GPU | ≤75°C temperature* | Thermal throttling |
*Requires WDDM 2.4+ drivers for temperature data.
Identifying Disk and Network Adapter Details
NVMe drives hit 3,500MB/s speeds—monitor Active Time in the Disk section. Spikes above 90% suggest storage limits. Network bandwidth consumption per app helps pinpoint background drains.
“Task Manager’s GPU tab revolutionized troubleshooting for graphics-intensive tasks by exposing VRAM allocation.”
Use the Resource Monitor (linked in Task Manager) for deeper process-level insights. Track disk queue length or network latency to isolate bottlenecks.
Accessing Detailed Specs via System Information
Windows includes a powerful built-in tool for comprehensive hardware analysis. The System Information utility (msinfo32) reveals over 38 categories of data—from USB controllers to BIOS versions—critical for upgrades and troubleshooting.
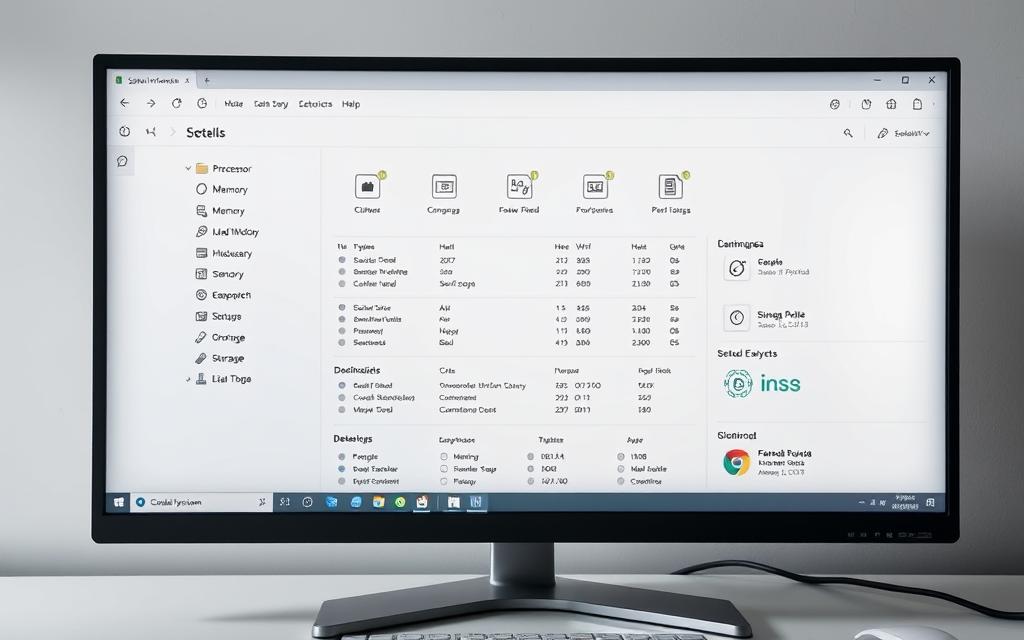
Launching System Information (msinfo32)
Press Windows + R, type msinfo32, and hit Enter. This bypasses Settings for direct access. Admins can also deploy this command remotely for enterprise asset tracking.
Key Sections: System Summary and Components
The System Summary displays core details like OS version and RAM. Dive into Components for storage, network adapters, and conflicts. USB 3.2 Gen 2×2 ports, for example, appear here—vital for high-speed peripherals.
Finding Motherboard and BIOS Details
Under System Summary, locate the BaseBoard Manufacturer for driver updates. BIOS versions are listed here too—critical for Ryzen 5000 compatibility. Export reports as .nfo files to share with support teams.
“SMBIOS data in System Information helps enterprises track hardware lifecycles and warranty status.”
Use the Resources tab to spot IRQ conflicts. For gamers, GPU details under Components > Display reveal driver versions and VRAM allocation.
Checking GPU and Display Specifications
Graphics performance directly impacts everything from gaming to video editing. Modern applications leverage GPU capabilities for rendering complex visuals efficiently. Whether evaluating upgrade needs or troubleshooting display issues, accurate component knowledge ensures optimal configurations.
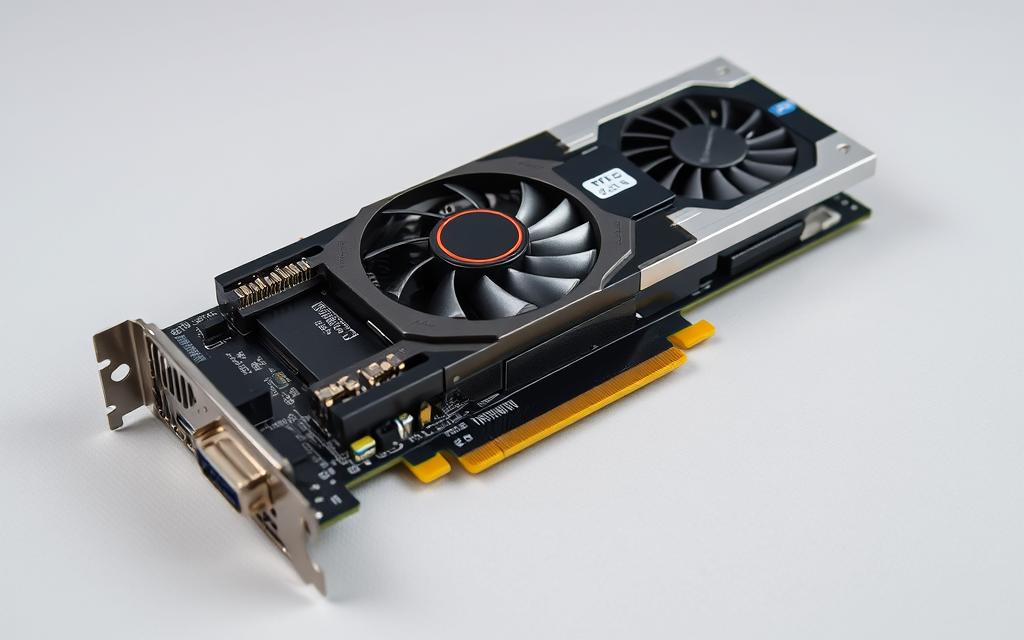
Locating GPU Details in System Tools
Windows offers multiple ways to identify your graphics card model and capabilities. The Task Manager’s Performance tab shows real-time utilization, while System Information provides technical specifications. For advanced diagnostics, DXDIAG delivers deeper driver and feature-set data.
Integrated Intel HD Graphics share system RAM, limiting performance. Discrete GPUs like NVIDIA RTX cards feature dedicated VRAM. Verify which type your system uses under Display Adapters in Device Manager.
Evaluating Display and Memory Requirements
4K streaming demands HDCP 2.2 support—check this under components in your graphics settings. Thermal throttling thresholds vary by manufacturer; sustained temperatures above 85°C often trigger performance drops.
Modern games require specific VRAM capacities:
- 1080p: 4-6GB minimum
- 1440p: 8GB recommended
- 4K: 10GB+ ideal
Confirm Vulkan or DirectX 12 Ultimate support in the task manager GPU section. These APIs enable advanced rendering features in current-generation titles and creative software.
How to Check Storage Drives and Memory
Storage and memory configurations determine system responsiveness and multitasking efficiency. Whether upgrading or troubleshooting, accurate details about drives and RAM prevent bottlenecks. Modern systems leverage NVMe speeds and dual-channel memory for peak performance.

Locating Disk Drive Models and Capacity
Windows lists storage details under Device Manager or Disk Management. Identify interface types (SATA vs. NVMe) and check health via SMART attributes:
- NVMe: Delivers 3,500MB/s+ speeds (look for “PCIe” in model names)
- SATA SSD: Caps at 600MB/s but remains cost-effective
- HDDs: Monitor “Reallocated Sectors Count” for early failure signs
Tools like Samsung Magician provide firmware updates and endurance metrics for SSDs.
Understanding RAM Slots and Speed
Task Manager’s Performance tab reveals installed RAM capacity and slots in use. DDR5-4800 offers 50% higher bandwidth than DDR4-3200 but requires compatible motherboards.
| RAM Type | Speed (MT/s) | Voltage | Upgrade Consideration |
|---|---|---|---|
| DDR4 | 2400–3200 | 1.2V | Budget-friendly, widely supported |
| DDR5 | 4800–6400 | 1.1V | Future-proof for gaming/content creation |
“Dual-channel configurations double memory bandwidth by utilizing paired slots—a free performance boost for most systems.”
For upgrades, match existing modules or replace all sticks to avoid compatibility issues. CPU-Z validates timings and channel configuration.
Using Command Prompt for Quick Specs
Windows offers powerful command-line tools for retrieving hardware details faster than GUI methods. The Command Prompt delivers instant access to system data, ideal for IT professionals or users needing raw specifications without extra software.
Running “systeminfo” for Basic Details
Type systeminfo in the Command Prompt to generate a comprehensive report. This reveals:
- Original OS installation date
- BIOS version and manufacturer
- Physical memory allocation
- Network adapter configurations
For targeted searches, pipe results with findstr. Example: systeminfo | findstr “Memory” isolates RAM details. Export reports using > specs.txt for documentation or troubleshooting.
Checking Disk Drives with WMIC Commands
The Windows Management Instrumentation Command-line (WMIC) provides granular storage insights. Execute wmic diskdrive list brief to identify:
| Property | Significance |
|---|---|
| Model | Manufacturer and interface type (SATA/NVMe) |
| MediaType | Confirms SSD vs HDD via rotational speed |
| Size | Total capacity in bytes (convert to GB/ TB) |
“WMIC commands help enterprises track hardware lifecycles by extracting unique identifiers like product UUIDs.”
Advanced users can check battery health with wmic path Win32_Battery or verify Secure Boot status via WMIC BIOS commands. These methods are particularly useful for remote system audits.
Advanced Methods: PowerShell and WMIC
Power users and IT professionals leverage advanced scripting tools for granular hardware insights beyond standard diagnostics. PowerShell and WMIC reveal lithography processes, PCIe allocations, and thermal metrics—critical for enterprise audits or precision upgrades.

Retrieving CPU and RAM Details via PowerShell
The Get-ComputerInfo cmdlet extracts 150+ parameters, including TPM 2.0 status for Windows 11 compliance. For targeted queries:
- Get-CimInstance Win32_Processor shows core counts and TDP ratings
- Get-CimInstance Win32_PhysicalMemory lists RAM speed and bank slots
Pipe results to Export-HTML for shareable reports. Example:
“Automated PowerShell scripts reduce manual inventory tasks by 80% in large-scale deployments.”
Generating a Full Hardware Report
WMIC commands complement PowerShell with low-level details. Compare outputs:
| Metric | PowerShell | WMIC |
|---|---|---|
| CPU Lithography | N/A | wmic cpu get architecture |
| PCIe Lanes | Get-PnpDevice | wmic path Win32_Bus get PNPDeviceID |
| Storage Health | Get-PhysicalDisk | wmic diskdrive get status |
For BIOS versions, wmic bios get serialnumber aids warranty checks. Combine both tools for exhaustive audits.
Third-Party Tools for Comprehensive Specs
Specialized software unlocks deeper hardware insights than built-in tools. While Windows provides basic diagnostics, applications like CPU-Z and Speccy deliver granular analysis for upgrades, troubleshooting, and performance tuning.
CPU-Z for Processor and Motherboard Info
This lightweight tool reveals critical components data often hidden in system reports. Key features include:
- Precision memory timings (e.g., CL16-18-18-38)
- Real-time graphics card clock speeds and voltage
- Benchmark comparisons against industry standards
Overclockers rely on its sensor data to monitor stability. The Validation feature helps identify counterfeit hardware by comparing specs to manufacturer databases.
Speccy for User-Friendly System Overviews
Piriform’s solution presents detailed information in an intuitive interface. Thermal readings for CPU, GPU, and drives help prevent overheating. Exportable reports simplify warranty claims or resale documentation.
“Speccy’s change history tracking detects unauthorized hardware modifications in corporate environments.”
For broader comparisons, explore these free system information tools. Whether optimizing gaming rigs or auditing enterprise devices, third-party software provides the visibility needed for informed decisions about your components.
Conclusion
Optimizing your device starts with understanding its capabilities. Built-in tools like System Information and third-party apps provide clear insights into critical components. Whether diagnosing issues or planning improvements, accurate data ensures informed decisions.
Proactive monitoring boosts performance and extends hardware lifespan. Quarterly audits help enterprises avoid downtime, while gamers benefit from real-time metrics. For upgrades, cross-reference manufacturer guidelines to confirm compatibility.
Regularly assessing your system prevents surprises. From RAM speeds to GPU temps, knowledge empowers better maintenance. Start with simple checks, then explore advanced tools for deeper analysis.
FAQ
Why should I review my computer specifications?
Knowing your device’s hardware helps with compatibility, upgrades, and troubleshooting performance issues.
Where can I find basic system details like CPU and RAM?
Open Settings > System > About for processor, memory, and Windows version.
How do I monitor real-time performance metrics?
Press Ctrl + Shift + Esc to launch Task Manager, showing CPU, GPU, and disk usage.
What’s the best way to get detailed hardware information?
Type msinfo32 in the Run dialog for a full breakdown, including motherboard and BIOS data.
Can I check my graphics card details without third-party software?
Yes—Task Manager’s Performance tab or System Information displays GPU model and VRAM.
How do I verify storage drive capacity and RAM speed?
Use System Information for disk models or Command Prompt’s wmic diskdrive list brief for storage.
Are there quick command-line methods to check specs?
Run systeminfo in Command Prompt for OS and hardware summaries.
What third-party tools provide the most comprehensive reports?
A: CPU-Z excels for CPU/motherboard details, while Speccy offers a clear system overview.


