Table of Contents
Are you looking to dive into the world of data analysis, calculation, and visualization? Look no further than Microsoft Excel, the popular spreadsheet program developed by Microsoft. As a component of the Microsoft Office suite, Microsoft Excel has become a staple tool for individuals and businesses alike.
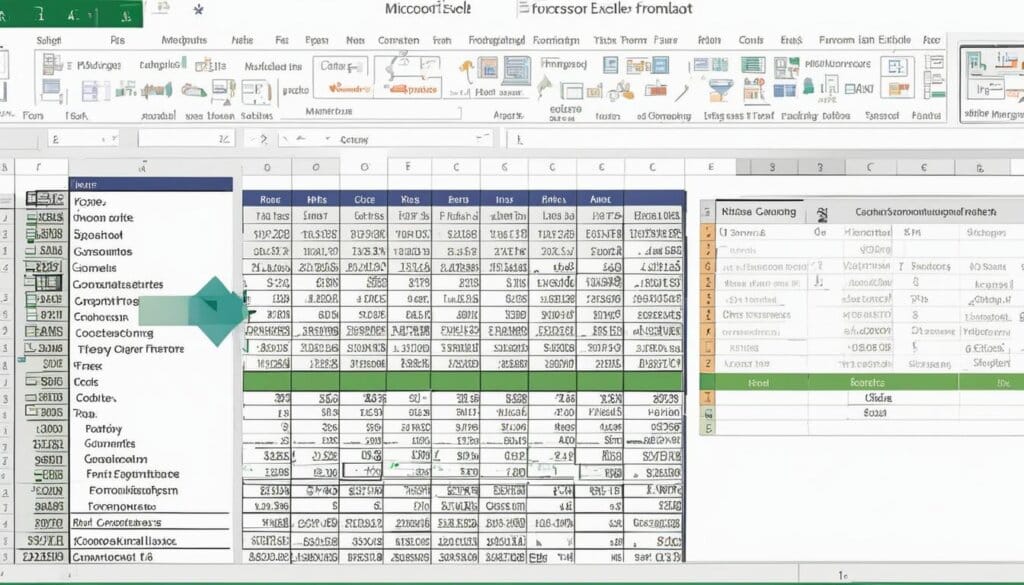
With Microsoft Excel, you can effortlessly format and organize data in a spreadsheet format, making it easier to view and analyze. The program consists of cells organized in rows and columns, allowing you to enter and manipulate data with ease.
Excel is not limited to one platform, as it is available for Windows, macOS, Android, and iOS. This compatibility ensures that you can access and work on your spreadsheets from any device.
Business professionals find Excel particularly valuable for a variety of tasks, including data analysis, business analysis, data entry and storage, performance reporting, accounting, and project management. The program offers a range of features, including graphing tools, pivot tables, and formulas, enabling you to analyze and visualize data in meaningful ways.
Whether you are a seasoned data analyst or just starting out, Microsoft Excel provides you with the necessary tools to transform raw data into valuable insights. Stay tuned to explore common use cases, key terminology, advanced capabilities, and the intriguing history and future of Excel.
Common Use Cases of Excel
Excel is an essential tool widely used in business settings for a variety of purposes. Its intuitive interface and powerful features make it a go-to application for professionals across industries. Let’s explore some of the common use cases and benefits of Excel.
Business Analysis
Excel is a valuable tool for business analysis. It allows users to organize and manipulate data to derive meaningful insights and make informed decisions. The ability to create custom formulas, perform calculations, and apply conditional formatting enables users to analyze complex data sets and identify trends and patterns.
“Excel’s versatility in handling data makes it a vital tool for business analysts. By leveraging its functions and features, analysts can extract actionable insights and drive strategic decision-making.”
Data Entry and Storage
Excel serves as a reliable platform for data entry and storage. Its structured format, with cells organized in rows and columns, allows organizations to collect and verify business data efficiently. The spreadsheet format also provides a visual representation of data, making it easier to review, edit, and update information as needed.
Data Analysis
When it comes to data analysis, Excel’s built-in tools and functions are invaluable. The graphing tools enable users to visualize data through charts and graphs, aiding in the identification of trends and patterns. Pivot tables allow for easy data manipulation and summarization, providing a deeper understanding of complex datasets.
Performance Reporting
Excel is widely employed for performance reporting due to its ability to present data in a structured and organized manner. Users can create customizable reports that include figures, charts, and tables to showcase key metrics and track performance over time. The flexibility of Excel allows for the customization of reports to suit specific reporting needs.
Excel’s widespread use in business analysis, data entry, data analysis, and performance reporting highlights its versatility and effectiveness as a tool for professionals in various industries. Its ability to handle large datasets, perform complex calculations, and present information in meaningful ways makes it an indispensable asset in modern business environments.
Key Terminology and Components of Excel
Excel, as a powerful spreadsheet program, has its own set of terminology and components that users need to understand in order to navigate and utilize its features effectively. Familiarizing yourself with these key terms and components will enhance your ability to work with Excel efficiently.
Cell and Cell Reference
In Excel, a cell is the fundamental unit where data is entered and stored. It is represented as the intersection of a column and a row. Each cell can contain various types of data such as numbers, text, dates, or formulas. To identify a specific cell, Excel uses a cell reference, which consists of coordinates representing its location in the spreadsheet. For example, cell B2 refers to the cell that is in the second column and second row.
Workbook and Worksheet
An Excel document is referred to as a workbook. It acts as a container for multiple worksheets, allowing users to organize and consolidate related information. Each worksheet within a workbook is an individual document that can be accessed by clicking on the corresponding tab located at the bottom of the spreadsheet. Worksheets enable users to work with different sets of data or perform separate calculations within a single workbook.
Formula and Formula Bar
Formulas are mathematical equations, cell references, or functions that allow users to perform calculations and manipulate data in Excel. They can be as simple as adding or subtracting numbers or as complex as utilizing built-in functions or referencing data from other cells. Formulas are entered in the formula bar, which is located at the top of the Excel window. It displays the contents of the active cell or allows users to input or edit values, formulas, or functions.
Additionally, the formula bar provides a convenient location for editing and reviewing formulas, enabling users to easily track and modify calculations.
Address Bar
Adjacent to the formula bar is the address bar, which displays the coordinates or reference of the active cell. It helps users quickly identify and reference specific cells while working with large datasets or complex formulas.

Understanding these key terminology and components of Excel will bring clarity to your use of the software, allowing you to leverage its powerful features and capabilities for data analysis, calculation, and visualization.
Advanced Capabilities of Excel
Excel offers advanced capabilities that go beyond basic data manipulation. These features enable users to perform complex calculations, analyze trends, and summarize data efficiently.
TREND Function
The TREND function in Excel is a powerful tool that allows users to calculate linear trend lines through a set of values. This function is particularly useful for time series trend analysis or projecting future trends. By applying the TREND function, users can obtain valuable insights into the direction and magnitude of data trends, facilitating informed decision-making.
VLOOKUP Function
The VLOOKUP function is an essential tool in Excel that enables users to search for values in a data set and retrieve corresponding data from another table. This function is commonly used for data analysis and data validation, allowing users to efficiently merge data from different sources and create comprehensive reports. With the VLOOKUP function, users can easily extract specific information, saving time and reducing manual errors.
PivotTable
PivotTables are a versatile data summarization tool in Excel. They allow users to manipulate and analyze large data sets by automatically sorting, filtering, and calculating data based on selected criteria. PivotTables provide a dynamic and interactive way to explore data, enabling users to uncover trends, patterns, and outliers quickly. With a few clicks, users can transform raw data into actionable insights.
MAX and MIN Functions
The MAX and MIN functions in Excel are powerful functions that find the maximum and minimum values, respectively, from a selected data set. By applying these functions, users can identify the highest and lowest values in a range of data, making it easier to analyze extremes and assess data variability. The MAX and MIN functions are widely used in various domains, such as finance, sales, and inventory management.
By leveraging these advanced capabilities, users can maximize the analytical and data manipulation potential of Excel, allowing them to extract meaningful insights and make data-driven decisions.
| Function | Description |
|---|---|
| TREND | Calculates linear trend lines through a set of values |
| VLOOKUP | Searches for values in a data set and retrieves corresponding data |
| PivotTable | Summarizes and analyzes large data sets using dynamic tables |
| MAX | Finds the maximum value from a selected data set |
| MIN | Finds the minimum value from a selected data set |
https://www.youtube.com/watch?v=6OX1TB04bQ0
History and Future of Excel
Excel, originally known as Microsoft Multiplan, made its debut in 1985 as a spreadsheet program. At that time, it faced tough competition from products like Lotus 1-2-3. However, with the release of Excel version 2.0 in 1987, the tide began to turn in Excel’s favor. The enhancements in this version led to increased popularity and surpassed sales of competing software.
Since then, Excel has continuously evolved, undergoing numerous updates and improvements. Each new version brought new features and functionalities, enhancing user experience and expanding the capabilities of the software. Notably, one significant milestone was the introduction of the Ribbon menu system in version 12 (2007). This innovative interface revolutionized the way users interacted with Excel, bringing more intuitive navigation and improved efficiency.
Today, Excel remains a vital tool in the business world, empowering professionals across various industries with its powerful data analysis and manipulation capabilities. As technology advances, we can expect Microsoft to continue investing in Excel’s development, with ongoing updates and future enhancements to meet the evolving needs of users.
FAQ
What is Microsoft Excel?
Microsoft Excel is a spreadsheet program developed by Microsoft. It is widely used for data analysis, calculation, and visualization.
What are the common use cases of Excel?
Excel is primarily used in business settings for activities such as business analysis, data entry and storage, performance reporting, accounting, and project management.
What are the key terminology and components of Excel?
Excel consists of cells organized in rows and columns. Cells have cell references and are organized in workbooks with multiple worksheets. Formulas can be used in Excel for calculations, and the formula bar is where values or formulas are entered.
What are the advanced capabilities of Excel?
Excel offers advanced functions such as TREND for trend analysis, VLOOKUP for searching and pulling data, PivotTables for data summarization, and MAX and MIN functions for finding maximum and minimum values.
What is the history and future of Excel?
Excel was initially released in 1985 as Microsoft Multiplan. It gained popularity with the release of version 2.0 in 1987. Excel continues to be a widely used tool with ongoing updates and developments expected in the future.


